Topics & analytics

Customer support analytics that drafts the fix

The numbers you would expect — and the one nobody else reports: what people keep asking, with the article that would stop them asking already drafted.

The short answer

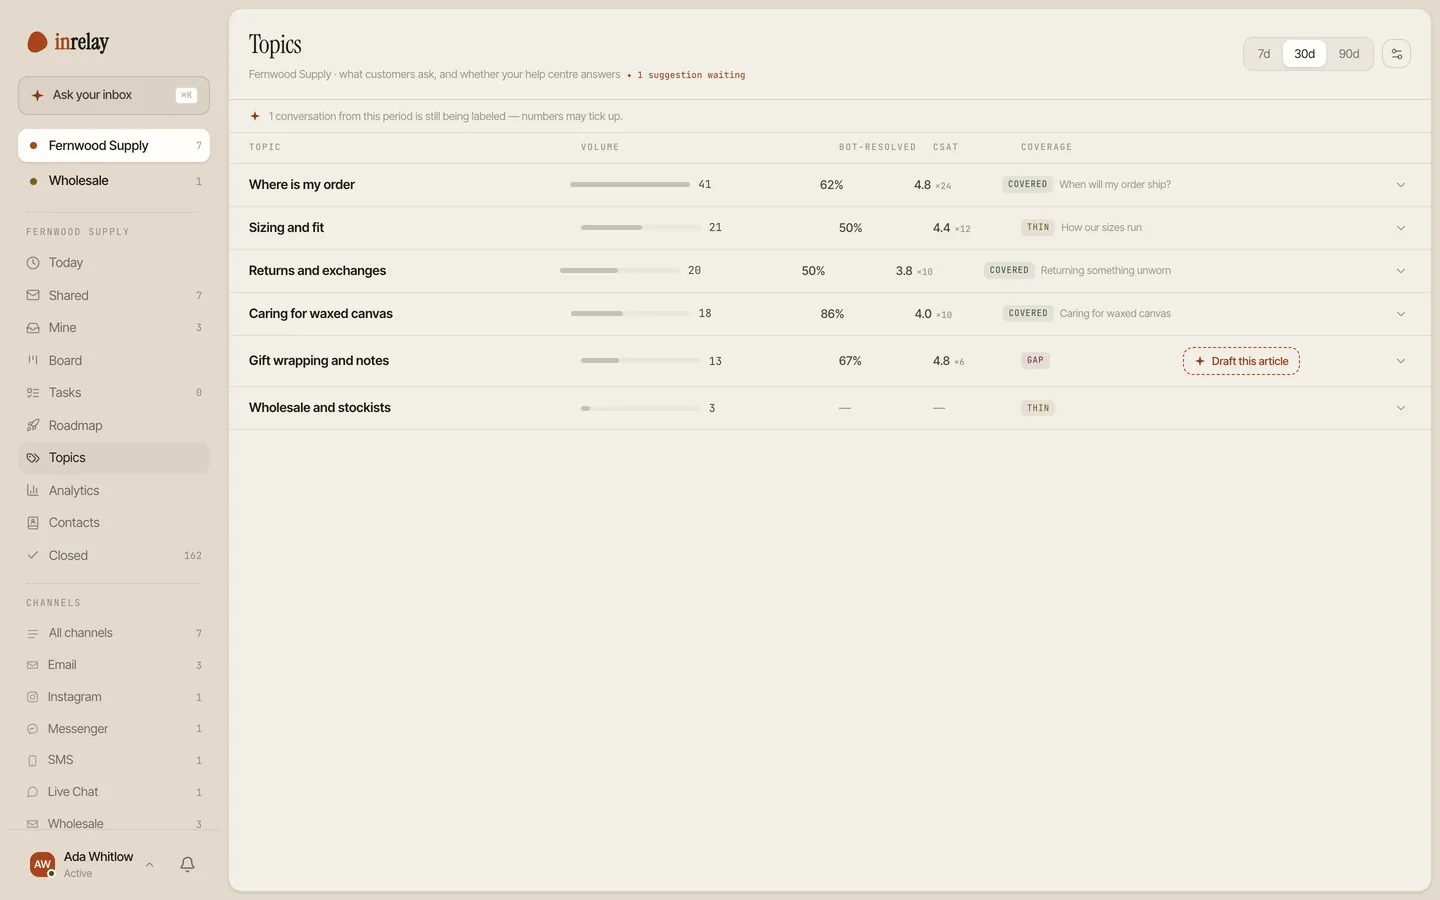
Customer support analytics turns inbox activity into something you can act on. inrelay groups closed conversations into topics and reports four numbers for each one: how many conversations it drew, how often the bot resolved it, how customers scored it, and whether your knowledge base actually covers it.
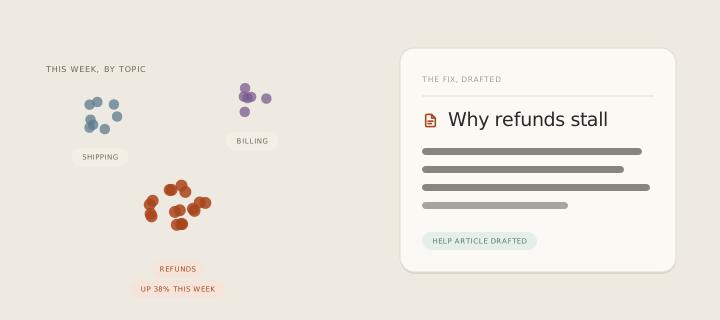
Looping animation: the week’s conversations sort into topics, refunds spikes 38 per cent, and the missing help article is drafted in response.

What it prevents is measuring the wrong thing. Volume and speed are easy to count and nearly useless on their own — they tell you the queue moved, not what the queue was about. A fast team answering the same avoidable question two hundred times looks excellent on a response-time chart.
01 · What it reports

How it works in inrelay

Two views sit beside the inbox. Analytics reports the operational numbers; Topics groups every conversation by what it was about, labelled when it closes against a list derived from your own threads rather than a generic category tree.

The Topics view
  • Volume, over 7, 30 or 90 days. How many conversations each topic actually drew in the window you pick — the honest ranking of what your support is about.
  • Bot resolution rate. Which subjects the chatbot genuinely handles and which it hands straight to a person — measured per topic, so you know where it earns its keep.
  • CSAT per topic. Scores from your surveys, averaged by subject rather than as one lifetime number — so a topic quietly scoring badly stops hiding inside a good quarter.
  • Knowledge base coverage. The column that makes the rest useful: covered, thin, or a flat gap — plus stale, when the article exists but the page it was written from has changed underneath it.
  • Open a topic and see the conversations. The real threads, with their channel, whether they were escalated, and the actual question each customer asked, distilled to a line.
  • The list stays yours. Rename a topic when the label is not quite your language, or merge two that turned out to be one — conversations move across without being counted twice.
  • Volume by channel, response and resolution times, and workload per teammate now ship as their own Analytics view, beside Topics. First response time counts the first reply from a person — bot replies are excluded, or the number would read in seconds and mean nothing.
  • Where conversations ended up: answered by the bot, handed to a teammate, teammate-only, or never answered. Every conversation lands in exactly one, and the bands add up to the total — click one to read those threads.
  • What your AI budget bought. Bot replies used this month against the cap you set, with the pace you are on. If you have set no cap, it says so and shows the count rather than inventing a bar.
  • AI-draft acceptance is still not reported, and this is a data limit rather than a plan: dismissing a draft deletes it and editing one overwrites the original, so there is nothing left to measure. It arrives when the record does.
02 · Honest by construction

Numbers that don’t flatter

Each conversation carries exactly one topic. That sounds like a limitation and is actually the thing that keeps every figure on the page true — a thread counted under two subjects would inflate both volumes and let one customer’s rating weigh twice.

The CSAT column is deliberately withheld until a topic has at least three responses, for everyone including admins. The average of a single response is that customer’s private rating wearing a disguise, and two is barely better. Below the floor the column shows a dash and tells you which reason applies — nobody has rated this yet, or the number is being held back to protect an individual.

Coverage is measured rather than assumed, too: an article has to genuinely be about a topic to count as covering it, not merely mention it in passing. And when the check itself fails, the topic keeps its last known coverage instead of dropping to “gap” and sending you off to rewrite something that already exists.

03 · The next action, written

How inrelay does it differently

Every support analytics product ends at the chart. You learn that “delivery” is 22% of your volume and your knowledge base says nothing about it, and then the tool’s job is finished and yours begins. inrelay drafts the article instead.

A topic marked as a gap carries a single action. Take it, and the real questions from those conversations go through the same generation pipeline that built your help centre, in your own brand voice, and the result lands in a review queue as a draft — facts it could not verify marked rather than invented. A stale article works the same way: the source page is re-read, the drift is found, and a rewrite is proposed for you to accept.

Nothing it writes is ever published on its own. The measurement, the suggestion and the draft are automatic; the decision is not. That is the whole difference between analytics you read and analytics that reduce next month’s volume.

The Topics view with a coverage gap: a question customers keep asking that no article answers yet, and the action that drafts one
04 · Set-up

Setting it up

Nothing, really

Labelling happens when a conversation closes. There is no tracking layer to install and no taxonomy to design up front — the topic list is built from your own closed threads.

Open Topics after a week

Give it enough closed conversations to be interesting, then read the list top-down. The order alone is usually the surprise.

Tidy the list once

Rename anything phrased oddly and merge the pair that turned out to be the same subject. It stays tidy after that.

Work the gaps

Take the draft action on the biggest gap, edit what it writes, publish. Watch that topic’s volume next month. The help docs cover each column’s exact definition.

Topic analytics are included on the Team and Studio plans. On Solo the view is visible and honest about it rather than hidden.

05 · Close neighbours

Works with the rest of the inbox.

Analytics reads what the other inrelay features write — these three feed it most.

Start today

Find the question behind the queue.

Free to start with your own inbox — every feature, no card, never per seat.

Questions, answered.

Do you report response times and workload?
They ship. Volume by channel, first-response and resolution times, and workload per teammate live in the Analytics view alongside Topics, with 7, 30 and 90-day ranges and a comparison against the previous period. Two things worth knowing before you read them: response times exclude bot replies, so the number reflects how long a person took; and durations are calendar time, not business hours, which the view states rather than leaves you to guess. One report is still missing — AI-draft acceptance — because dismissing a draft deletes it and editing one overwrites the original, so the product isn’t yet keeping a record we could honestly count. The changelog announces launches; we don’t publish dates we’d have to walk back.
Why is a CSAT figure sometimes just a dash?
Because a mean of one response is that person’s individual rating, which is private. Topic averages appear once at least three people have rated — for admins too, so the column can never become a way around that. The response count is still shown, so a dash reads as “not enough yet” rather than as something broken.
Who decides what the topics are?
They are derived from your own closed conversations, aiming for a manageable handful of broad subjects rather than a label per thread. Then you own them: rename anything phrased oddly, merge two that are really one, and conversations follow without being double-counted.
Does it publish the articles it drafts?
Never. A gap or a stale article produces a draft in a review queue, in your brand voice, with anything it could not verify marked for you. Publishing is a person’s decision — the same rule as approve before send.

Start running your DMs.

Give your customers faster answers and your team their evenings back.

Desktop and mobile. Free for solo.